Dr Paddy Barrett
Consultant Cardiologist, My Heart Health – Blackrock Clinic – www.MyHeartHealth.ie
Cardiometabolic diseases are a leading cause of morbidity and mortality worldwide. However, 80-90 per cent of the risk factors that are responsible for causing cardiometabolic disease are identifiable. Up to 80 per cent of premature cardiometabolic disease is preventable.
Taken together, these three facts suggest that we have an identifiable, preventable set of diseases that still result in a significant healthcare burden and that we have substantial scope for improvement.
At the core of this issue is understanding the risk of a major cardiovascular event usually over a 10-year timeframe. There are several validated risk calculators available to assess the estimated 10-year risk of an event including the European Society of Cardiology’s HeartScore, QRisk and Framingham risk calculators. The risk factors typically included in these calculators are the patient’s age, sex, blood pressure, cholesterol and smoking status.
Categorisation into low, medium and high-risk groups is largely used to both define a patient’s risk category and also serve as a decision tool as to whether a person should receive lifestyle advice alone or be considered for pharmacotherapies.
Although a cornerstone of cardiovascular risk assessment, there is no doubt that degrees of imprecision exist with such calculators and additional cardiovascular risks can remain hidden or poorly estimated.
When examined in detail, almost all risk calculators specifically state that certain additional cardiovascular risk modifiers may influence the ultimate percentage risk calculation, but the degree of risk modification is not stated. This is not a problem with the calculators, this is simply down to less precise modelling being available for such risk modifiers.
This article aims to explore some of the additional hidden risks and the strategies that are available to address them. It bears restating that the use of the standard risk calculators already mentioned should be the first step in assessing a patient’s cardiovascular risk status and the inclusion of additional modifiers typically only serves to recalibrate an individual’s 10-year risk of an event.
An important concept to mention at the outset is that of the ‘prevention paradox’ which explains why the majority of events occur in those at low to medium risk rather than those at high risk. This is explained by the fact that the highest risk groups typically have far fewer total ‘at risk’ numbers in the group and even though the relative event rate is lower in low to medium risk groups the total number of events tends to be greater. Said another way, is that a small percentage of a very big number is usually more than a large percentage of a small number. The prevention paradox explains why 50 per cent of cardiovascular events in men and 33 per cent of cardiovascular events in women occur at under 65 years of age; a typically low to medium risk group. This fact emphasises why identifying and managing hidden cardiovascular risk in younger age and risk groups is so crucial.
Furthermore, when we dig deeper and truly understand where a patient’s risk is coming from, we can focus our efforts more specifically at modifying that risk. Although much of cardiovascular risk reduction is by way of an empirical approach, it would be remiss not to pull the lever of greatest risk the hardest. This is why an appreciation of the full spectrum of a patient’s risk is crucial.
Risk factors hidden in plain sight
Lipoprotein (a)
Lipoprotein (a) or Lp(a) is an LDL-like particle, which at high levels contributes to an increased risk of cardiovascular disease. Higher levels of Lp(a) are genetically mediated and it is frequently a significant contributing risk factor when cardiovascular disease presents at an early time-point in families. An increased risk of cardiovascular events is seen in those with Lp(a) levels above 50mg/dl, but even above 30mg/dl there is a linear increase in risk. Although population level screening is typically not recommended by most societies, with a 20-30 per cent prevalence it certainly needs to be considered in any individual with a concerning family history of early cardiovascular disease or where ambiguity exists as to which risk category a person falls into.
The familial element also raises the necessity to consider cascade screening in families. Reluctance to testing for Lp(a) has primarily been driven by the fact that no specific therapy exists to adequately reduce serum levels and also reduce clinical events. Although niacin and PCSK9 inhibitors do result in reductions of Lp(a), they have not yet demonstrated clinical outcome benefit. However, the recent development of hepatic specific antisense oligonucleotides has demonstrated reductions in levels of Lp(a) of 80-90 per cent but the clinical outcome studies have yet to be completed. While statin therapies can actually increase levels of Lp(a), for those at high risk, the use of statin therapy is still recommended.
Apoliprotein B (APOB)
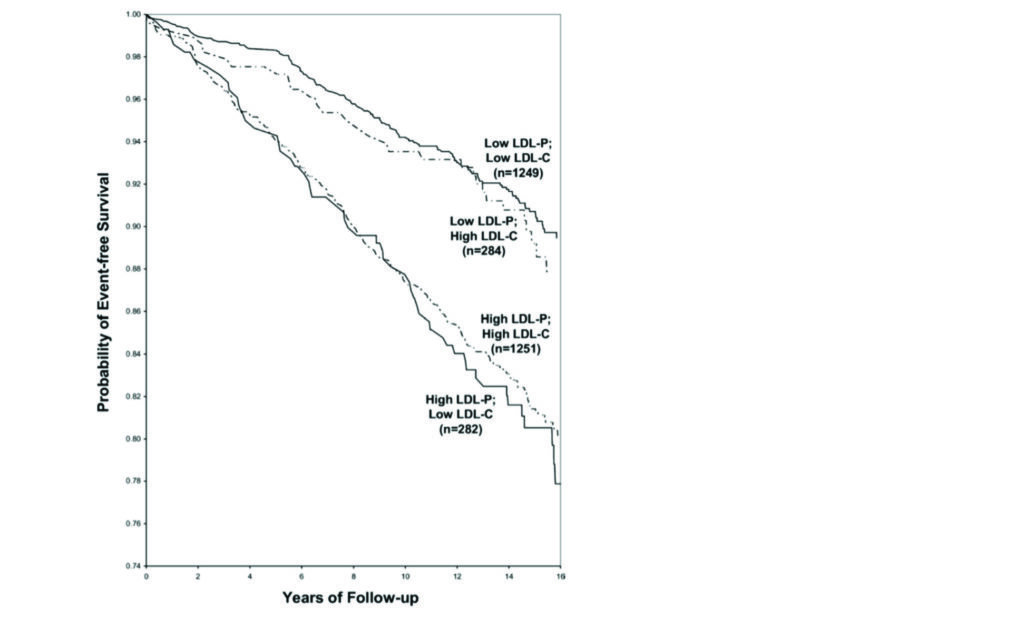
LDL, or more specifically low-density lipoprotein particles, are a fundamental component of the development process of coronary atherosclerosis. However, when measuring LDL cholesterol by standard lab measurements we do not routinely measure the number of LDL particles (LDL-P) in the blood, we instead measure LDL-C, which is a measure of the total amount of circulating LDL cholesterol. The risk of coronary artery disease tracks most reliably with the number of circulating LDL particles rather than the total amount of cholesterol carried in these particles. Typically, this is not an issue as there usually exists a linear relationship between LDL-C and LDP-P. In patients with significant metabolic dysfunction however, eg, diabetes, this linear relationship can become unreliable.
What we observe is that the risk of coronary artery disease tracks more reliably with the LDL-P rather than the LDL-C (Figure 1). The concern here is that some patients will have normal LDL-C concentrations, but abnormal LDL-P concentrations by extension carry an unobserved additional residual cardiovascular risk. Although assessment of LDL-P is currently unavailable in Ireland, measurement of APOB is available. LDL-P and APOB exist in a one-to-one relationship so therefore can be used as an accurate proxy. With the growing prevalence of cardiometabolic dysfunction it is understood if a discordance exists between LDL-C and LDL-P/APOB it is important in identifying those who carry additional often unobserved residual risk. Importantly, reduction of LDL-P/APOB can be achieved with adequate lipid lowering therapies.
Cardiovascular genetics
Beyond single gene defects that are responsible for the development of familial hyperlipidaemia, the majority of the genetic influence on cardiovascular risk is as a result of a broad polygenic risk. Aggregating the known multiple genes responsible for the development of cardiovascular disease into a combined score is known as a genomic risk score (GRS). The use of such genomic risk scoring systems certainly holds promise and will likely form an integral part of how we assess cardiovascular risk in the future. Several cardiovascular GRSs are available and have shown that those in the highest risk category can have up to four times the risk of lifetime cardiovascular disease compared to those in the lowest risk category.
While the inclusion of genomic risk scores is not recommended by most guideline committees’, patients are increasingly accessing such risk-scoring platforms themselves and as clinicians we are left with little clarity on how to integrate them into our overall risk assessment. It is important to note that gene defects identified in the APOE gene, traditionally obtained by direct to consumer genetic testing, also increase the risk of cardiovascular disease in addition to early onset Alzheimer’s disease. Knowledge of this fact may not necessarily recalibrate our overall risk assessment but is likely to be a cause of concern for the patient. Whether or not genomic risk scoring is included in future risk scoring evaluations, the most important point to remember is that adoption of healthy lifestyle measures can reduce the risk of future premature cardiovascular events by up to 50 per cent, even in those at increased genetic risk. Ultimately, such genetic risks are probabilistic not deterministic.
Sleep
Increasing evidence suggests a strong relationship between abnormal sleep patterns and increased risk of cardiovascular disease. Shorted sleep duration has been linked to a 40 per cent increased risk of cardiovascular mortality and a host of other cardiometabolic risk parameters including hypertension, poor dietary patterns and worsening insulin resistance. While the evidence linking poor sleep patterns with worsening cardiovascular metrics continues to mount, it is important to note that most of the literature is based on observational data that can be significantly influenced by multiple confounding variables.
Recent five-year prospective data of MESA participants has demonstrated approximately twice the risk of cardiovascular events in those with irregular sleep patterns. More importantly is the identification and management of obstructive sleep apnoea, which often goes undiagnosed and can carry up to a 70 per cent increased risk of cardiovascular events. A key part of the cardiovascular history must include an evaluation of a patient’s sleep patterns and whether or not a patient snores as an indicator of obstructive sleep apnoea.
Insulin resistance/metabolic syndrome
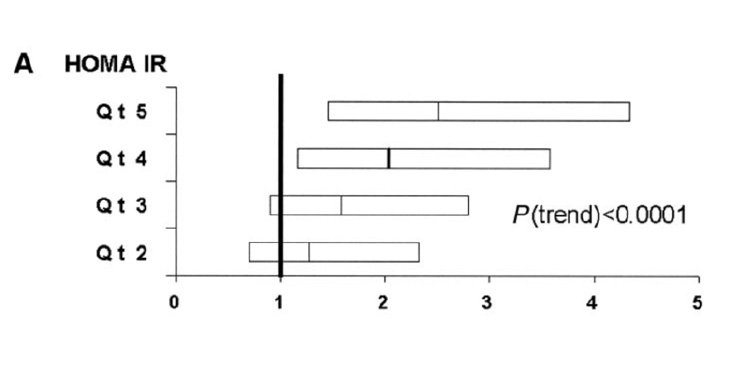
Over 50 per cent of the US population have either prediabetes or diabetes and only 12 per cent of the US population have ideal cardiometabolic risk markers. Metabolic syndrome is very often the precursor condition that substantially increases a patient’s risk, not only of cardiovascular disease but a range of chronic conditions including diabetes, heart failure, atrial fibrillation and sleep apnoea. The diagnosis of metabolic syndrome is made when a patient has any three of the following five features: Increased waist circumference, elevated blood pressure, abnormal glycaemic control, increased triglycerides, or low HDL. The physiological disturbance that underpins metabolic syndrome is insulin resistance.
While insulin resistance as a biochemical entity is rarely directly tested by means of assessment of serum insulin levels in the fasted and fed state, its relationship to cardiometabolic risk is clear (Figure 2). The key factor to note is that insulin resistance can precede the appearance of abnormal glycaemic features by several years and therefore go unrecognised and unaddressed. Increasing focus on the assessment of insulin resistance by calculating a HOMA-IR score is identifying the insulin-resistant phenotype in a growing population of patients. The HOMA-IR score entails a fasting measurement of serum insulin and glucose with a score above two suggestive of insulin resistance.
The use of HOMA-IR is used as a surrogate to the gold standard assessment of a euglycaemic clamp study, which is rarely performed outside of research settings. Caution must be exercised when interpreting serum insulin levels due to its pulsatile nature and the use of non-standardised insulin assays. What is clear is the physiological entity of insulin resistance is an often unrecognised cardiometabolic risk factor, which typically phenotypically manifests by way of the clinical features of metabolic syndrome.
Cardiac CT
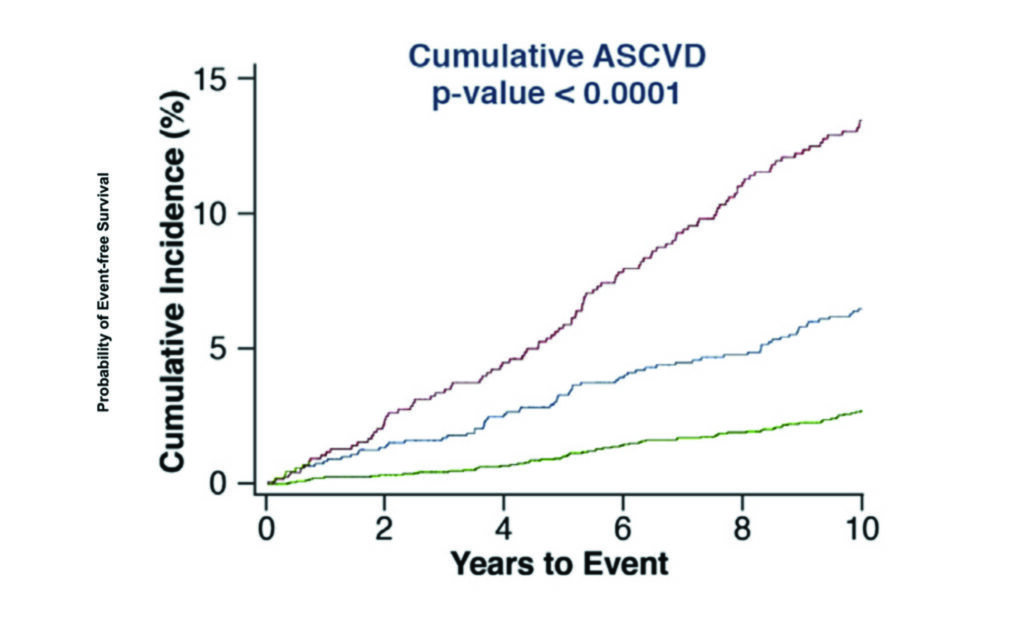
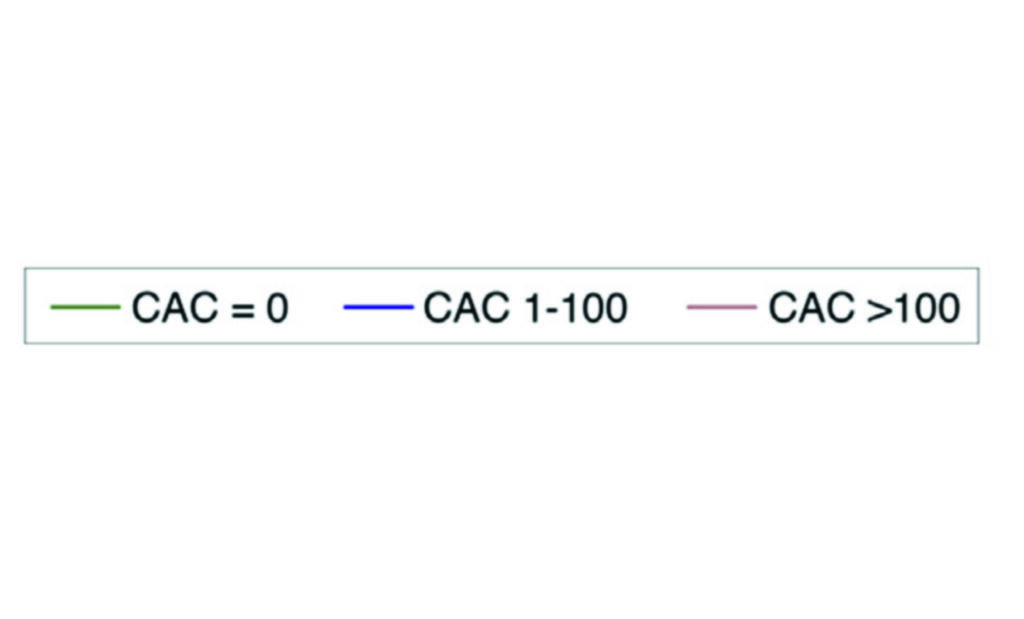
Having a risk factor is not the same as having the disease. All cardiovascular risk assessments ultimately aim to identify those who will go on to develop coronary artery disease and subsequently have a clinical event because of it. Whether or not a patient already has established coronary atherosclerosis is one of the most significant indicators as to whether they will ultimately have a clinical event. CT coronary artery calcium (CAC) scoring has become a key tool in appropriately risk stratifying those in the low or intermediate risk category and is now firmly embedded in the European and US guidelines on cardiovascular risk assessment. While any evidence of calcified atherosclerosis does confer some additional risk, a calcium score of greater than 100 or above the 75th percentile is typically reflective of a significantly elevated cardiovascular risk and also indicates the likelihood of benefiting from risk reduction therapies (Figure 3). With CAC scores greater than 300 the risk of an event approaches that seen in those considered in the secondary prevention risk category. The converse, however, is also true with those having a CAC of zero having a risk of a major adverse cardiovascular event at 10 years as low as 1.4 per cent.
Caution must be exercised in interpreting calcium scores of zero in young patients as the risk models typically maintain validity out to 12 years and estimation of risk in the young must take into account lifetime risk also. Furthermore, those with a yearly increase in CAC score of greater than 15 per cent have a substantially higher risk of clinical events compared to those with a less than 15 per cent yearly change. In addition to the measurement of CAC score, assessment of high-risk atherosclerotic plaque features seen only on CT coronary angiography assist in identifying atherosclerotic lesions at higher risk of clinical relevance. There is no doubt that the use of cardiac CT methodologies is one of the most powerful tools we have available in identifying those at the highest cardiovascular risk.
Although accurate assessment of cardiovascular risk is an integral component of high-quality cardiovascular care, we must always remind ourselves and our patients that what the patient does to reduce their long-term cardiovascular risk is likely to make a much greater impact than anything we can do as clinicians. Lifestyle modifications have consistently demonstrated large reductions in the risk of cardiovascular events over the lifespan of the patient.
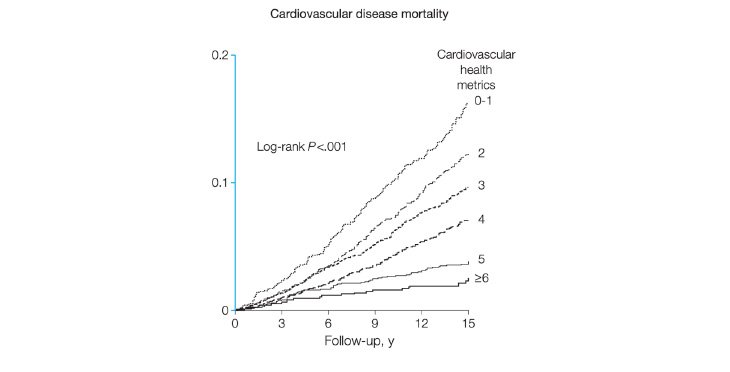
Unfortunately, only rarely achieved, adherence to six or more of the American Heart Association’s (AHA’s) seven health metrics of not smoking, being physically active, having normal blood pressure, glucose and cholesterol, and eating a healthy diet has been linked to a 76 per cent reduction in cardiovascular mortality over a 14-year period (Figure 4).
Beyond accurate long-term cardiovascular risk assessment, we must always act to help our patients achieve as many of the seven health metrics described so as to meaningfully reduce or delay the sequalae of a condition that is most likely to be responsible for their mortality.
In the meantime, we must continually strive to identify and manage all the risks that a patient may carry, both seen and sometimes unseen.
References on request






Leave a Reply
You must be logged in to post a comment.